AI Tool Turns Weather Satellites Into High-Resolution Ocean Current Maps
Researchers have unveiled a new artificial intelligence tool called GOFLOW that is transforming routine weather satellite imagery into high-resolution maps of ocean currents, giving scientists their first continuous view of small, fast-moving flows that have long evaded direct observation. Developed by an international team of oceanographers and machine learning engineers, the system tracks how patterns of sea surface temperature shift from one satellite pass to the next and uses those tiny displacements to infer the velocity of the water beneath.
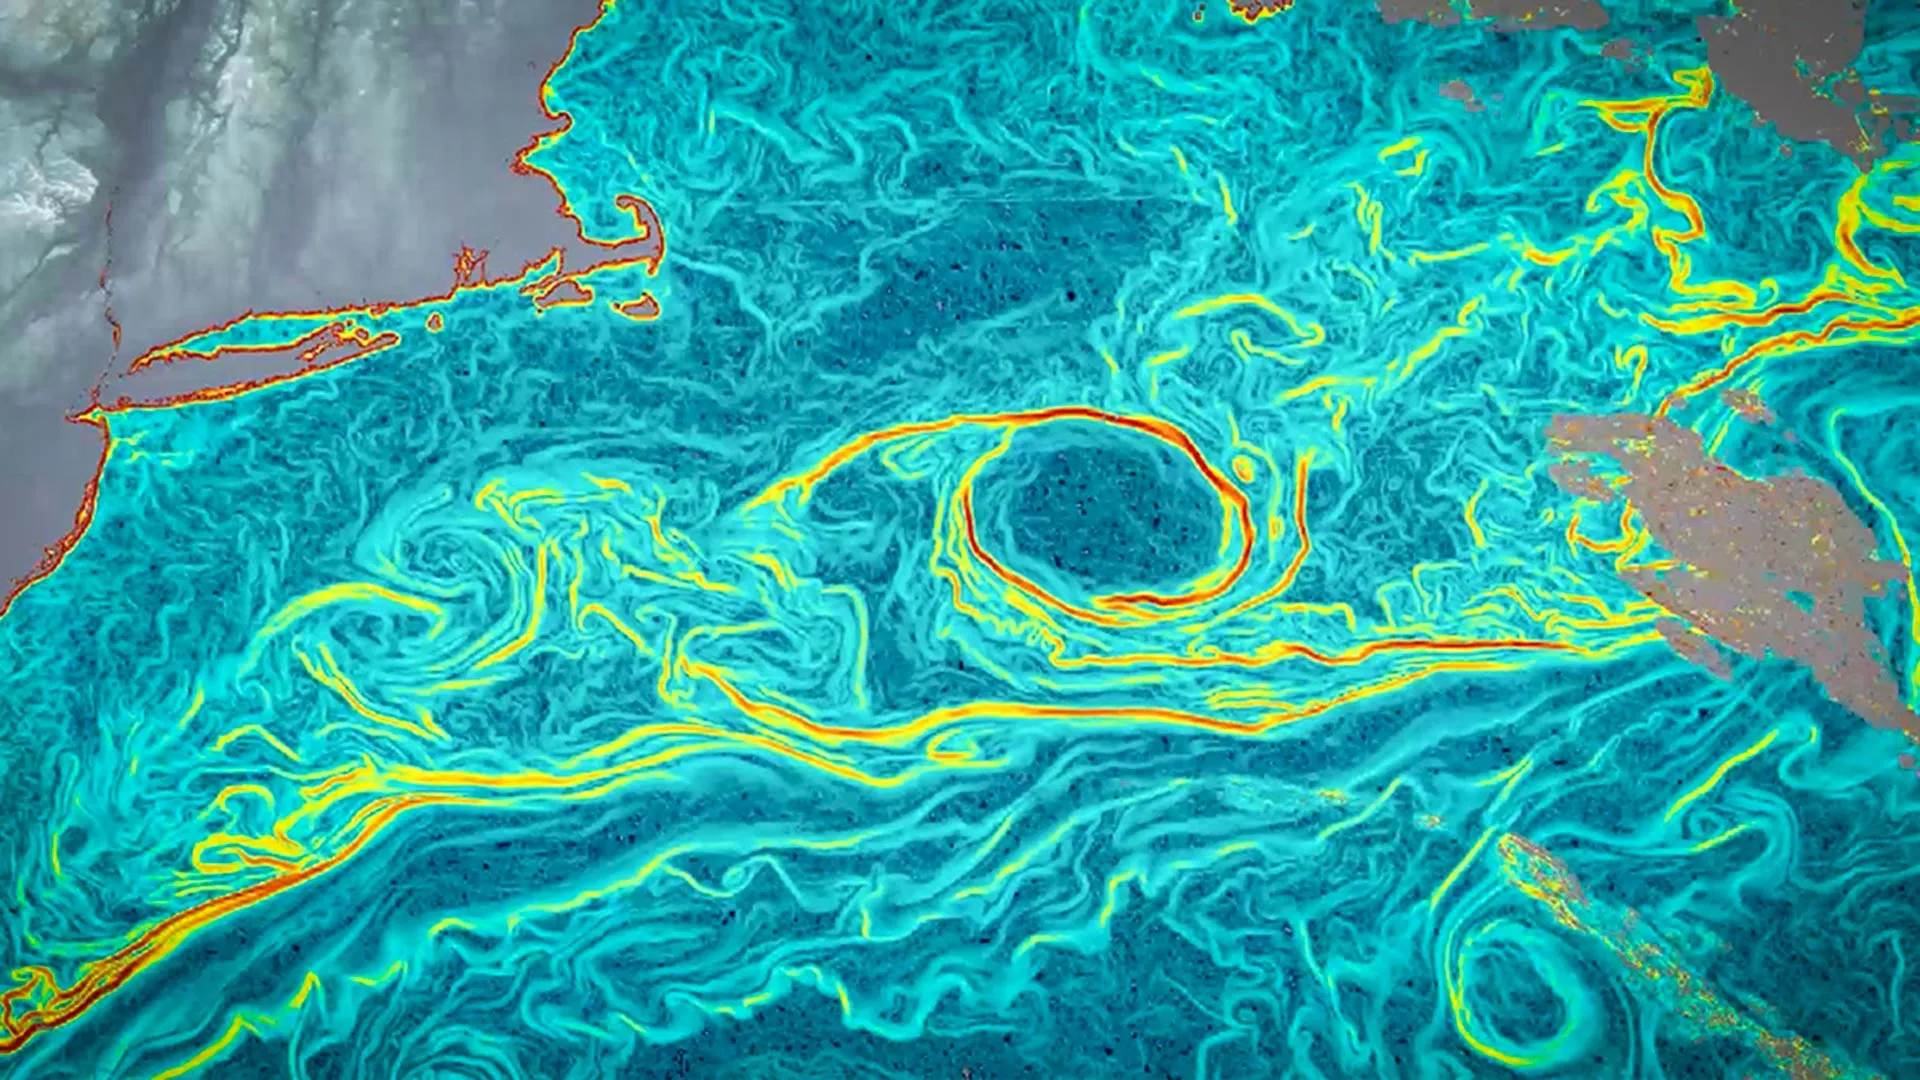
Ocean currents are the circulatory system of the climate. Large-scale features such as the Gulf Stream and the Kuroshio move staggering quantities of heat from the tropics toward the poles, while smaller eddies and filaments stir nutrients, disperse pollutants, and shuffle carbon between the surface and the deep sea. Yet until now, most current observations have come from a sparse mixture of drifting buoys, moored instruments, and specialized radar altimeters that cannot resolve features smaller than tens of kilometers across.
GOFLOW changes that picture by exploiting the fact that weather satellites already observe sea surface temperature at a far higher resolution than altimeters can manage. The algorithm learns to associate temperature gradients, fronts, and swirl patterns with the underlying flow field, drawing on years of coincident high-resolution model output and research cruise data. Once trained, it can infer velocities at spatial scales of around a kilometer, an order of magnitude finer than what altimeters deliver.
The implications for climate science are substantial. Small-scale currents are thought to control a large share of vertical mixing in the upper ocean, which in turn regulates how quickly heat and carbon dioxide absorbed at the surface are carried into deeper layers. If GOFLOW can document those flows routinely, modelers can test theoretical relationships against real observations and refine the parameterizations that climate models rely on to represent sub-grid processes.
Marine ecology stands to benefit as well. Fish larvae, plankton blooms, and microplastic particles are all swept along by small eddies that have until now been invisible. Continuous mapping of these flows could help fisheries managers forecast where productive waters will form, guide search and rescue operations at sea, and improve oil spill response by tracking where surface pollutants are likely to go.
One key advantage of the approach is its cost profile. Because GOFLOW uses existing weather satellites, it does not require new spacecraft or dedicated missions. The team has made its software open source and plans to release daily global maps through an academic portal, lowering the barrier for researchers who lack the computational resources to process raw satellite data themselves. Early users include national meteorological services, port operators, and offshore wind developers.
The method does have limits. Because it depends on visible or infrared temperature signatures, GOFLOW performs best in cloud-free conditions and in regions with strong thermal gradients. Persistent cloud cover over parts of the Southern Ocean, for example, can leave gaps in the maps that must be filled by interpolation or combined with observations from other sensors. The authors are working on a multi-sensor fusion approach that incorporates microwave imagery, which can see through clouds but at coarser resolution.
Validation exercises comparing GOFLOW-derived currents with shipboard acoustic Doppler measurements have shown strong agreement in the upper tens of meters of the ocean, where satellite temperature signatures are most closely tied to flow. Deeper structures are harder to resolve and will likely require additional data streams. Still, the new tool represents a significant leap in what can be seen from space with instruments already in orbit.
For climate researchers, oceanographers, and coastal managers alike, GOFLOW offers an opportunity to fill one of the largest blind spots in the observational record. With climate change accelerating circulation changes across the world's oceans, having a clearer view of the surface flow field has never been more important.
Operational forecasting centers are already beginning to evaluate how GOFLOW outputs could feed into weather and climate models. The National Oceanic and Atmospheric Administration is running pilot experiments to see whether the new current fields improve short-term marine forecasts and hurricane intensity predictions, because warm or cool water brought to the surface by small eddies can strongly influence tropical cyclone development. European and Australian agencies have launched similar pilots, and several universities are developing graduate courses that teach students to interpret the new data alongside traditional altimetry. A second promising application is Arctic sea ice forecasting. Melting ice introduces fresh, buoyant water to the surface, which is then carried away by surface currents. Better maps of those currents could sharpen predictions of ice extent weeks or even months ahead, a capability that would directly benefit shipping companies, indigenous communities, and wildlife managers working in rapidly changing polar environments. Beyond scientific uses, there is growing interest from the private sector. Aquaculture operators, desalination plant designers, and offshore renewable energy developers all have reasons to understand near-surface flows at kilometer scale. A stable, open-source mapping system reduces the cost of entry for smaller firms that cannot afford proprietary data products. For the researchers behind GOFLOW, the next year will involve scaling up computation, refining the algorithm's treatment of cloudy regions, and training specialists in developing coastal nations where local expertise has historically been limited. The goal is not simply to publish better maps but to seed a global community of practice around high-resolution ocean observation.